 Web Server Statistics for tb3.com Web Server Statistics for tb3.com
(Go To: Top: General Summary: Daily Summary: Hourly Summary: Domain Report: Organization Report: Operating System Report: Status Code Report: File Size Report: File Type Report: Directory Report: Request Report)
This report contains overall statistics.
Successful requests: 26,950
Average successful requests per day: 26,967
Successful requests for pages: 18,361
Average successful requests for pages per day: 18,372
Failed requests: 3,915
Redirected requests: 10
Distinct files requested: 7,995
Distinct hosts served: 3,118
Corrupt logfile lines: 408
Data transferred: 4.78 gigabytes
Average data transferred per day: 4.78 gigabytes
(Go To: Top: General Summary: Daily Summary: Hourly Summary: Domain Report: Organization Report: Operating System Report: Status Code Report: File Size Report: File Type Report: Directory Report: Request Report)
This report lists the total activity for each day of the week, summed over all the weeks in the report.
Each unit ( ) represents 500 requests
for pages or part thereof.
) represents 500 requests
for pages or part thereof.
day: #reqs: #pages:
---: -----: ------:
Sun:     0:      0:
Mon:     0:      0:
Tue:     0:      0:
Wed:     0:      0:
Thu:     0:      0:
Fri:     0:      0:
Sat: 26950:  18361:
(Go To: Top: General Summary: Daily Summary: Hourly Summary: Domain Report: Organization Report: Operating System Report: Status Code Report: File Size Report: File Type Report: Directory Report: Request Report)
This report lists the total activity for each hour of the day, summed over all the days in the report.
Each unit () represents 30 requests
for pages or part thereof.
hour: #reqs: #pages: ----: -----: ------: 0: 655: 534:1: 625: 529:
5: 640: 506:
16: 985: 839:
17: 1048: 902:
(Go To: Top: General Summary: Daily Summary: Hourly Summary: Domain Report: Organization Report: Operating System Report: Status Code Report: File Size Report: File Type Report: Directory Report: Request Report)
This report lists the countries of the computers which requested files.

Listing domains, sorted by the amount of traffic.
#reqs: %bytes: domain
-----: ------: ------
11760: 67.46%: .com (Commercial)
13007: 21.89%: [unresolved numerical addresses]
  950:  4.11%: [unknown domain]
  413:  2.87%: .net (Networks)
  480:  0.83%: .de (Germany)
   34:  0.49%: .info (Informational)
   20:  0.28%: .ca (Canada)
   53:  0.26%: .vn (Vietnam)
   36:  0.26%: .ru (Russia)
   22:  0.18%: .br (Brazil)
   15:  0.16%: [domain not given]
   13:  0.16%: .in (India)
   11:  0.16%: .it (Italy)
    8:  0.10%: .bg (Bulgaria)
    6:  0.09%: .dk (Denmark)
    6:  0.09%: .ch (Switzerland)
    8:  0.08%: .arpa (Arpanet)
   14:  0.07%: .cz (Czech Republic)
    4:  0.06%: .zw (Zimbabwe)
    3:  0.04%: .at (Austria)
    3:  0.04%: .ac (Ascension Island)
    3:  0.04%: .fi (Finland)
   12:  0.03%: .pl (Poland)
    3:  0.03%: .edu (US Higher Education)
    2:  0.03%: .cn (China)
    3:  0.02%: .mx (Mexico)
    2:  0.02%: .ua (Ukraine)
    7:  0.02%: .ar (Argentina)
    2:  0.02%: .bd (Bangladesh)
    1:  0.02%: .us (United States)
    2:  0.02%: .co (Colombia)
    1:  0.01%: .il (Israel)
    1:  0.01%: .ee (Estonia)
    1:  0.01%: .be (Belgium)
   11:  0.01%: .nl (Netherlands)
    1:  0.01%: .sk (Slovakia)
    1:       : .do (Dominican Republic)
    2:       : .za (South Africa)
    1:       : .uz (Uzbekistan)
    2:       : .ke (Kenya)
    1:       : .ao (Angola)
    1:       : .ba (Bosnia-Herzegovina)
    5:       : .org (Non Profit Making Organizations)
    1:       : .pk (Pakistan)
    1:       : .ci (Ivory Coast)
    1:       : .bn (Brunei Darussalam)
    2:       : .uk (United Kingdom)
    2:       : .cl (Chile)
    1:       : .ge (Georgia)
    1:       : .ni (Nicaragua)
    2:       : .io (British Indian Ocean Territory)
    1:       : .np (Nepal)
    3:       : .kz (Kazakhstan)
    1:       : .cc (Cocos (Keeling) Islands)
    1:       : .se (Sweden)
    1:       : .ai (Anguilla)
    1:       : .gr (Greece)
(Go To: Top: General Summary: Daily Summary: Hourly Summary: Domain Report: Organization Report: Operating System Report: Status Code Report: File Size Report: File Type Report: Directory Report: Request Report)
This report lists the organizations of the computers which requested files.

Listing the top 20 organizations by the number of requests, sorted by the number of requests.
#reqs: %bytes: organization
-----: ------: ------------
 5381:  3.61%: amazonaws.com
 5220:  1.09%: 77
 4210: 53.68%: hosted-by-vdsina.com
 3227:  2.91%: 5
  950:  4.11%: [unknown domain]
  601:  0.29%: webmeup.com
  482:  0.40%: 43
  475:  0.07%: 91
  434:  0.40%: 216.244
  401:  2.82%: petalsearch.com
  389:  0.38%: your-server.de
  292:  0.26%: 47
  246:  0.05%: 147.90
  245:  0.04%: sogou.com
  174:  2.23%: 185.229
  138:  0.53%: semrush.com
  132:  0.07%: 27
  124:       : ahrefs.net
  117:  0.14%: 129.146
  103:  0.55%: apple.com
 3609: 26.34%: [not listed: 459 organizations]
(Go To: Top: General Summary: Daily Summary: Hourly Summary: Domain Report: Organization Report: Operating System Report: Status Code Report: File Size Report: File Type Report: Directory Report: Request Report)
This report lists the operating systems used by visitors.

Listing operating systems, sorted by the number of requests for pages.
 #: #reqs: #pages: OS
--: -----: ------: --
 1: 15246:  13668: Windows
  : 14509:  12980:   Windows NT
  :   731:    685:   Unknown Windows
  :     1:      1:   Windows 2000
  :     4:      1:   Windows XP
  :     1:      1:   Windows CE
 2:  2985:   2819: OS unknown
 3:  1185:    790: Macintosh
 4:  6681:    686: Unix
  :  6678:    684:   Linux
  :     2:      2:   Other Unix
  :     1:      0:   BSD
 5:   724:    396: Known robots
 6:     1:      0: OS/2
(Go To: Top: General Summary: Daily Summary: Hourly Summary: Domain Report: Organization Report: Operating System Report: Status Code Report: File Size Report: File Type Report: Directory Report: Request Report)
This report lists the HTTP status codes of all requests.

Listing status codes, sorted numerically.
#reqs: status code
-----: -----------
26276: 200 OK
  526: 206 Partial content
   10: 301 Document moved permanently
  148: 304 Not modified since last retrieval
 3914: 404 Document not found
    1: 405 Method not allowed
(Go To: Top: General Summary: Daily Summary: Hourly Summary: Domain Report: Organization Report: Operating System Report: Status Code Report: File Size Report: File Type Report: Directory Report: Request Report)
This report lists the sizes of files.
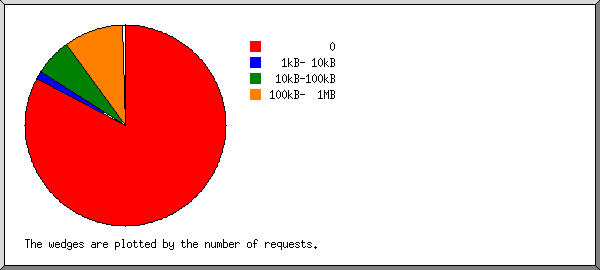
       size: #reqs: %bytes:
-----------: -----: ------:
          0:   621:       :
   1B-  10B:     2:       :
  11B- 100B:    43:       :
 101B-  1kB:  1322:  0.02%:
  1kB- 10kB:  6204:  0.43%:
 10kB-100kB: 12591:  7.22%:
100kB-  1MB:  6132: 82.19%:
  1MB- 10MB:    25:  2.17%:
 10MB-100MB:     9:  4.36%:
100MB-  1GB:     1:  3.61%:
(Go To: Top: General Summary: Daily Summary: Hourly Summary: Domain Report: Organization Report: Operating System Report: Status Code Report: File Size Report: File Type Report: Directory Report: Request Report)
This report lists the extensions of files.

Listing extensions with at least 0.1% of the traffic, sorted by the amount of traffic.
#reqs: %bytes: extension
-----: ------: ---------
10139: 83.46%: .html [Hypertext Markup Language]
 6741:  4.20%: .jpg  [JPEG graphics]
    1:  3.61%: .zip  [Zip archives]
  135:  3.32%: .mpg  [MPEG movie]
 6559:  1.23%: [directories]
    2:  1.10%: .tmp
    3:  0.98%: .divx
    1:  0.44%: .mpgx
   11:  0.35%: .pdf  [Adobe Portable Document Format]
    3:  0.29%: .current
  293:  0.26%: .JPG
  373:  0.22%: .gif  [GIF graphics]
    2:  0.17%: .avi  [AVI movies]
 1663:  0.11%: .htm  [Hypertext Markup Language]
 1024:  0.26%: [not listed: 16 extensions]
(Go To: Top: General Summary: Daily Summary: Hourly Summary: Domain Report: Organization Report: Operating System Report: Status Code Report: File Size Report: File Type Report: Directory Report: Request Report)
This report lists the directories from which files were requested. (The figures for each directory include all of its subdirectories.)

Listing directories with at least 0.01% of the traffic, sorted by the amount of traffic.
#reqs: %bytes: directory
-----: ------: ---------
14563: 84.65%: /priv_stats/
 7592:  8.99%: /tesla/
    1:  3.61%: /dl/
  191:  0.59%: http://
 1381:  0.44%: /jlwedding/
  872:  0.44%: /clwedding/
  129:  0.30%: /pyro/
    2:  0.24%: /ibd/
  280:  0.12%: /hs25reunion/
   63:  0.11%: /rafting/
  786:  0.09%: [root directory]
   98:  0.08%: /stats/
   12:  0.08%: /ebay/
  215:  0.08%: /racetrack/
  143:  0.07%: /gc/
  237:  0.03%: /baby/
   38:  0.03%: /street/
   30:  0.03%: /space/
   53:  0.02%: /dlake/
  264:  0.02%: [not listed: 13 directories]
(Go To: Top: General Summary: Daily Summary: Hourly Summary: Domain Report: Organization Report: Operating System Report: Status Code Report: File Size Report: File Type Report: Directory Report: Request Report)
This report lists the files on the site.

Listing files with at least 20 requests, sorted by the number of requests.
#reqs: %bytes:          last time: file
-----: ------: ------------------: ----
 5467:  1.10%: Jul/25/26 11:58 PM: /priv_stats/
 4126: 59.57%: Jul/25/26 11:57 PM: /priv_stats/usage_202607.html
 3224:  2.90%: Jul/25/26  8:43 PM: /priv_stats/usage_202512.html
  712:  0.05%: Jul/25/26 11:28 PM: /
  597:  8.49%: Jul/25/26 10:58 PM: /priv_stats/usage_202606.html
  248:  0.01%: Jul/25/26 11:57 PM: /jlwedding/reception2/res/js/keyboard.js
  247:  0.01%: Jul/25/26 11:57 PM: /jlwedding/shower2/res/js/keyboard.js
  113:  1.53%: Jul/25/26 11:43 PM: /priv_stats/usage_202206.html
   94:       : Jul/25/26  9:00 PM: /cgi-bin/vhcount.pl
   10:       : Jul/25/26  7:52 PM:   /cgi-bin/vhcount.pl?index.html
   65:  0.92%: Jul/25/26  7:53 PM: /priv_stats/usage_202303.html
   60:  0.84%: Jul/25/26 11:59 PM: /priv_stats/usage_202408.html
   32:  0.47%: Jul/25/26  9:05 PM: /priv_stats/usage_202302.html
   29:  0.44%: Jul/25/26 10:03 PM: /priv_stats/usage_201010.html
   27:  0.38%: Jul/25/26 10:38 PM: /priv_stats/usage_202201.html
   26:  0.37%: Jul/25/26  7:17 PM: /priv_stats/usage_202107.html
   25:  0.35%: Jul/25/26 11:16 PM: /priv_stats/usage_202007.html
   25:  0.39%: Jul/25/26 11:07 PM: /priv_stats/usage_201508.html
   22:  0.33%: Jul/25/26 11:34 PM: /priv_stats/usage_201102.html
   21:       : Jul/25/26  7:52 PM: /favicon.ico
   20:  0.29%: Jul/25/26  6:21 PM: /priv_stats/usage_202108.html
   20:  0.01%: Jul/25/26  9:00 PM: /tesla/ratcb2006/
11750: 21.55%: Jul/25/26 11:59 PM: [not listed: 7,851 files]
(Go To: Top: General Summary: Daily Summary: Hourly Summary: Domain Report: Organization Report: Operating System Report: Status Code Report: File Size Report: File Type Report: Directory Report: Request Report)

